Using samples within SAS Visual Analytics
For quick testing purposes, these samples can be used by Data-Driven Content (DDC) objects within a SAS Visual Analytics (VA) report directly from GitHub, without the need of deploying them in a Web server, or SAS Content Server, or the DDC Server. For example, to reference the circle packing sample, set the URL of the DDC object to be:
https://sassoftware.github.io/sas-visualanalytics-thirdpartyvisualizations/samples/d3_circlePacking.html
Notes:
- Due to recent security measures for sandboxed iframes adopted by Chrome browsers that removed download capability,
export2CSV.htmlwill only work with Chrome in VA 8.5.1 and above. - Example
d3_FunnelChart.htmlrequiresd3-funnel.js. This funnel chart implementation was obtained from https://github.com/jakezatecky/d3-funnel
Sample Visualizations for Data-Driven Content Objects
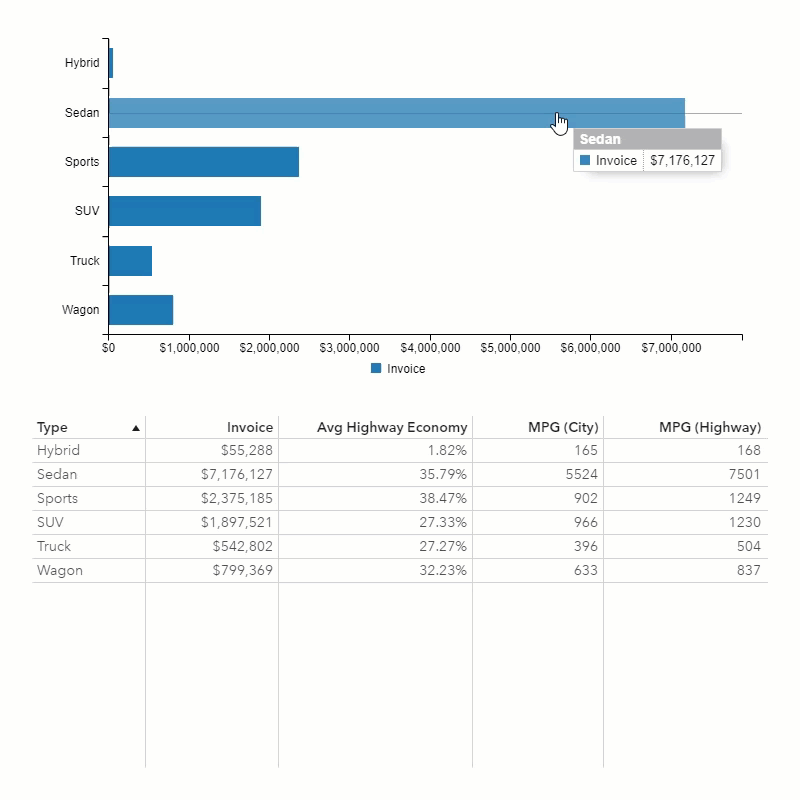
C3 Bar Chart | Code
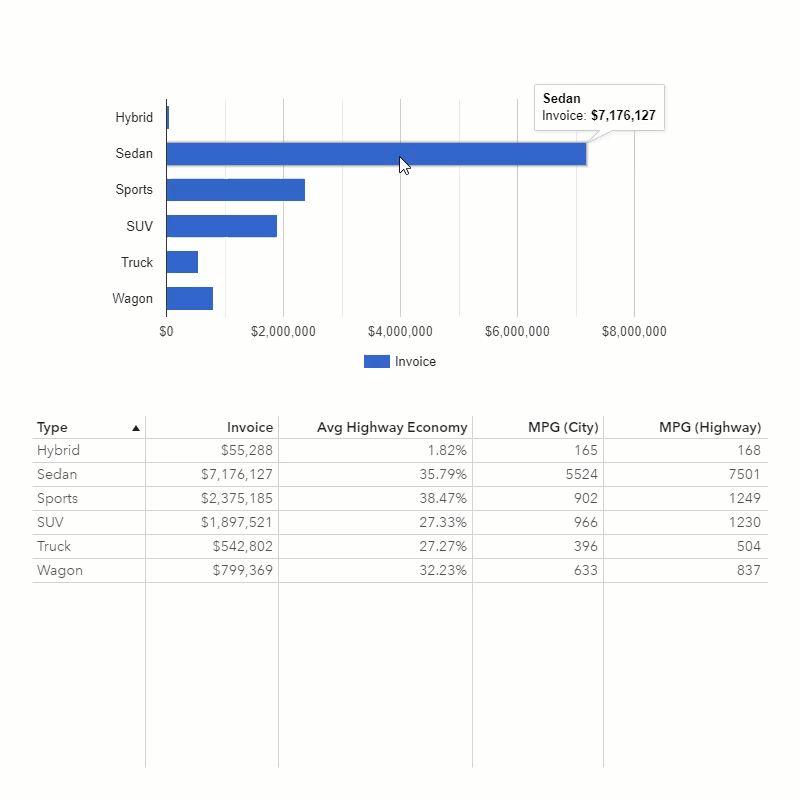
D3 Bar Chart | Code | Demo
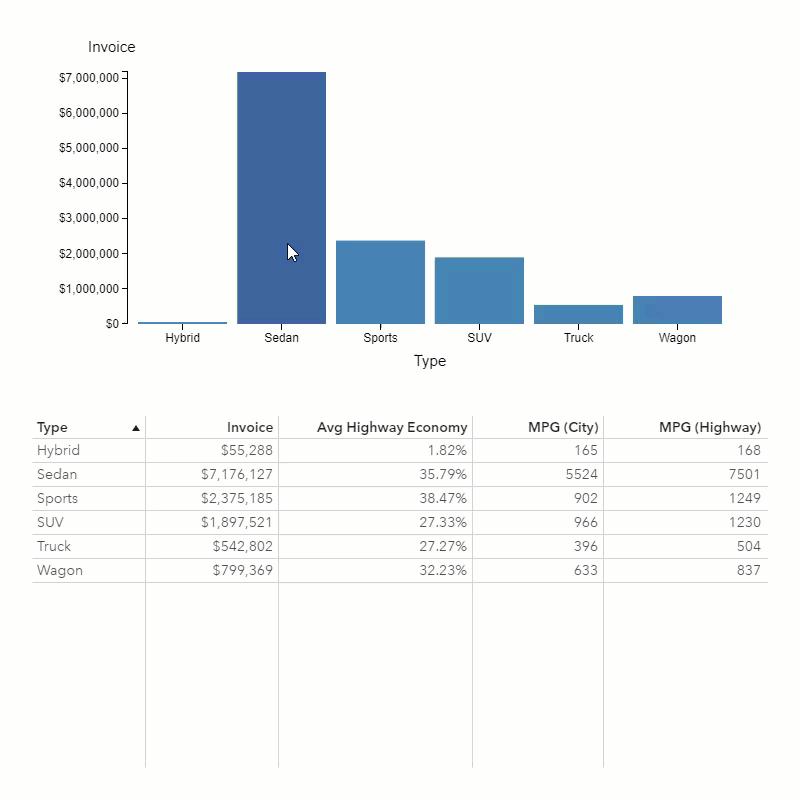
Google Bar Chart | Code
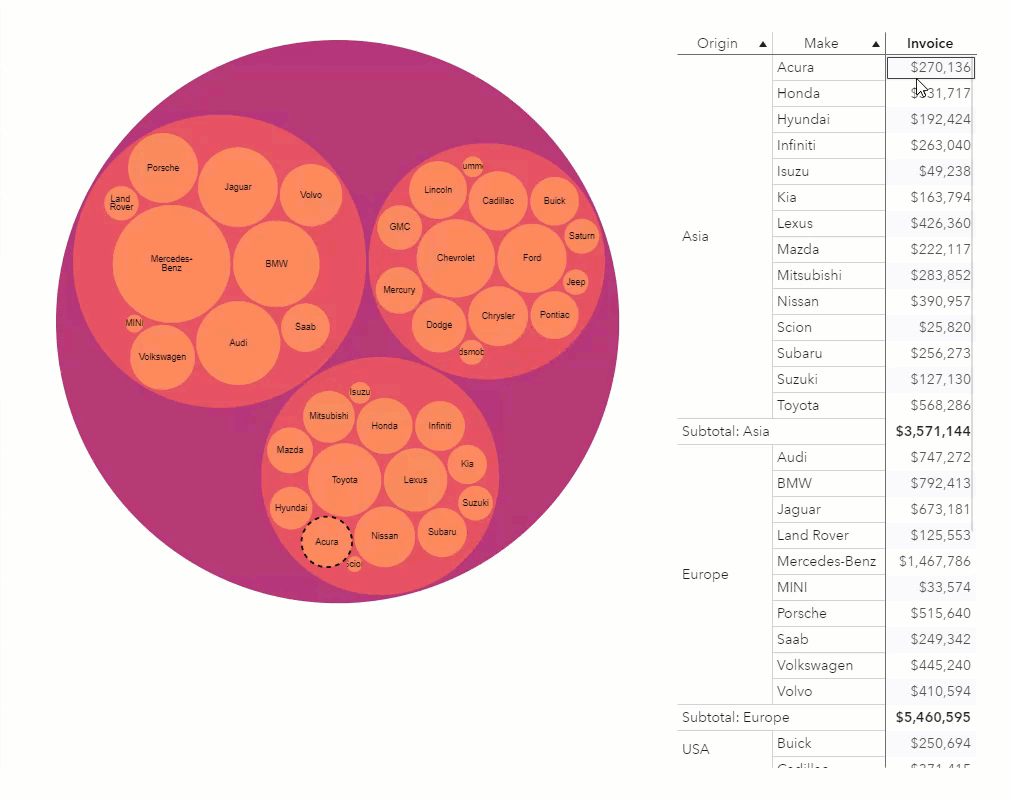
D3 Circle Packing | Code | Demo
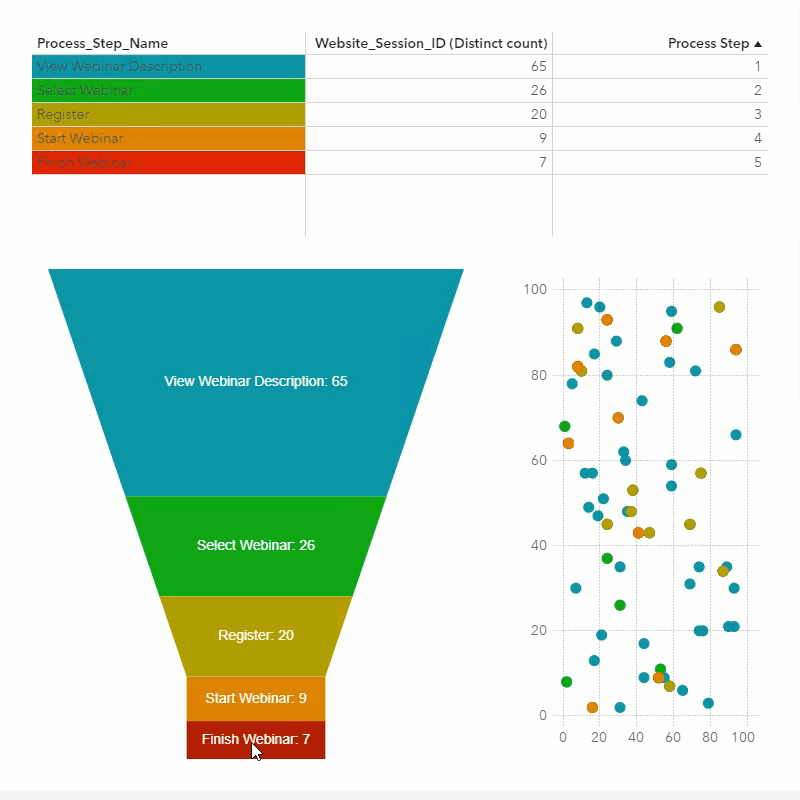
D3 Funnel Chart | Code | Demo
D3 Network Diagram | Code | Demo

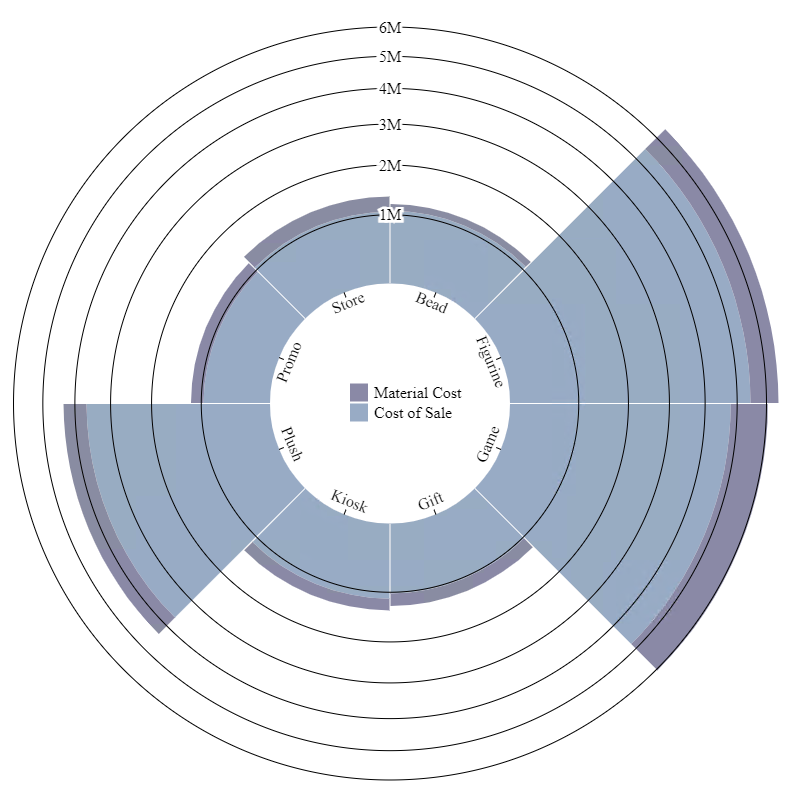
D3 Radial Stacked Bar | Code
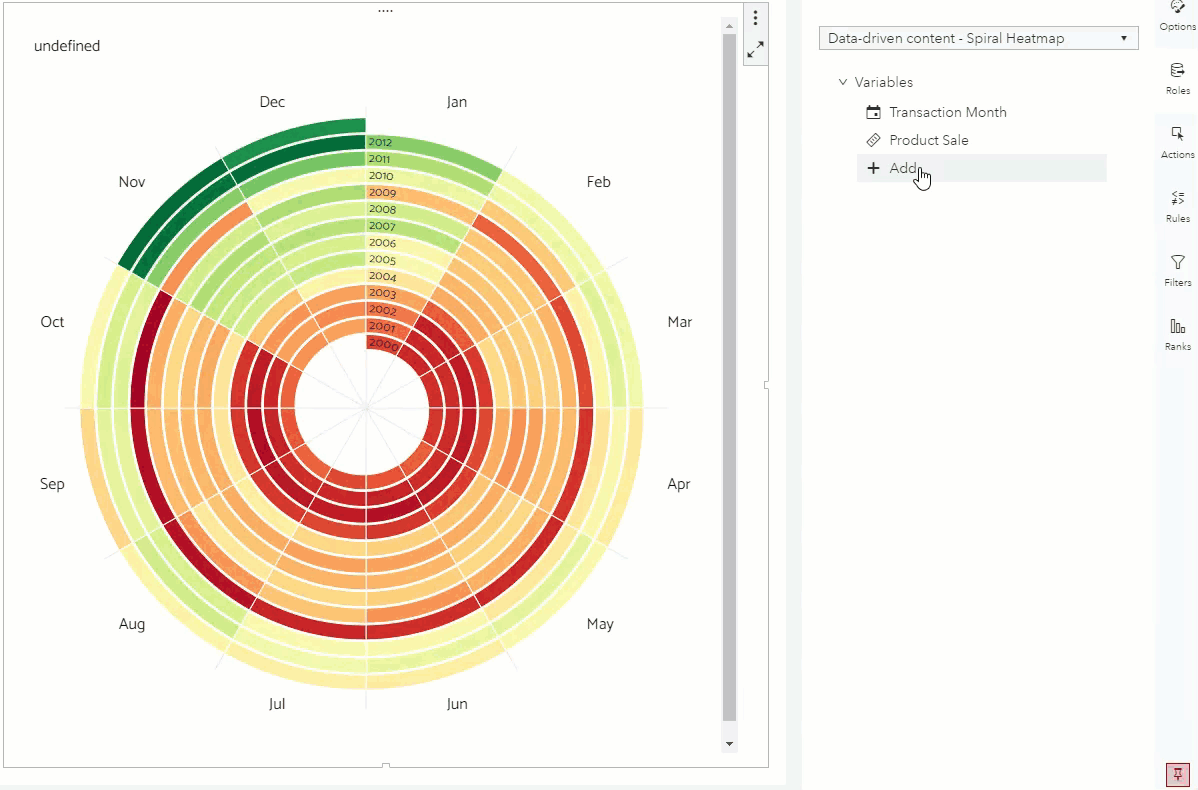
D3 Spiral Heatmap | Code
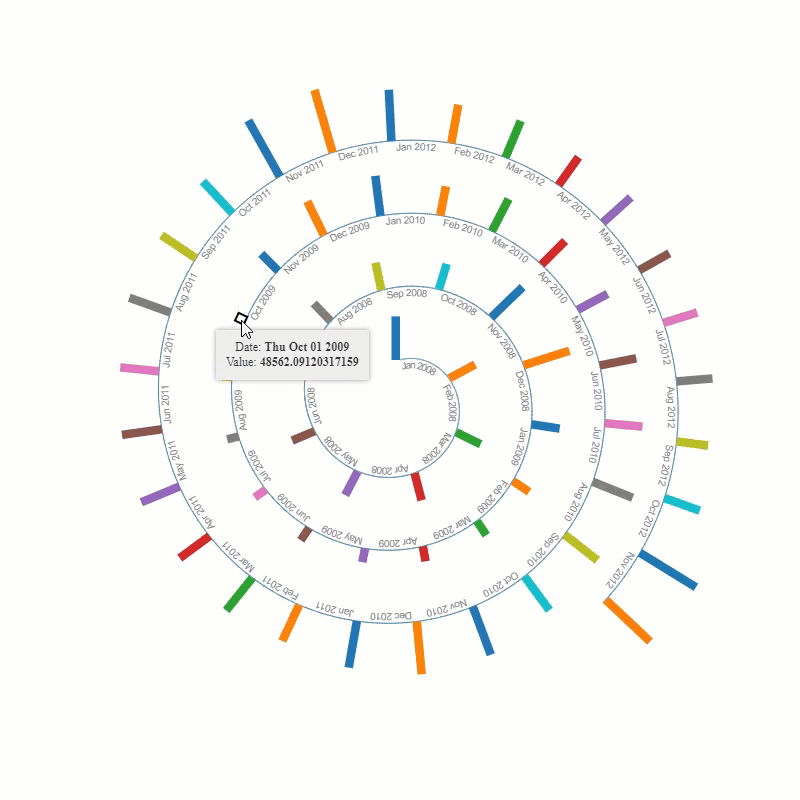
D3 Spiral Plot | Code
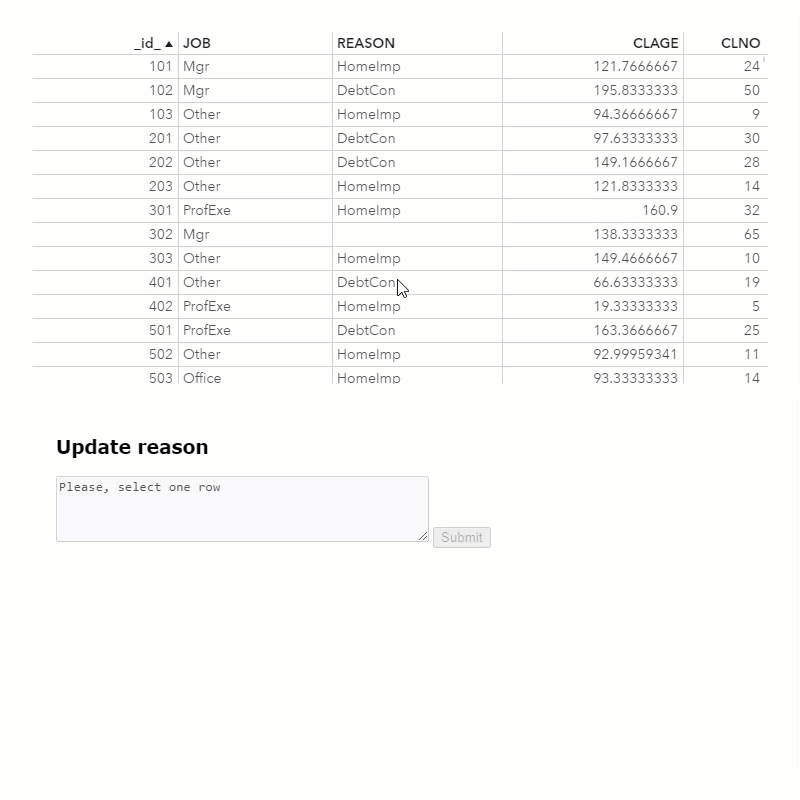
Data Update | Code | Code.v4 | Demo
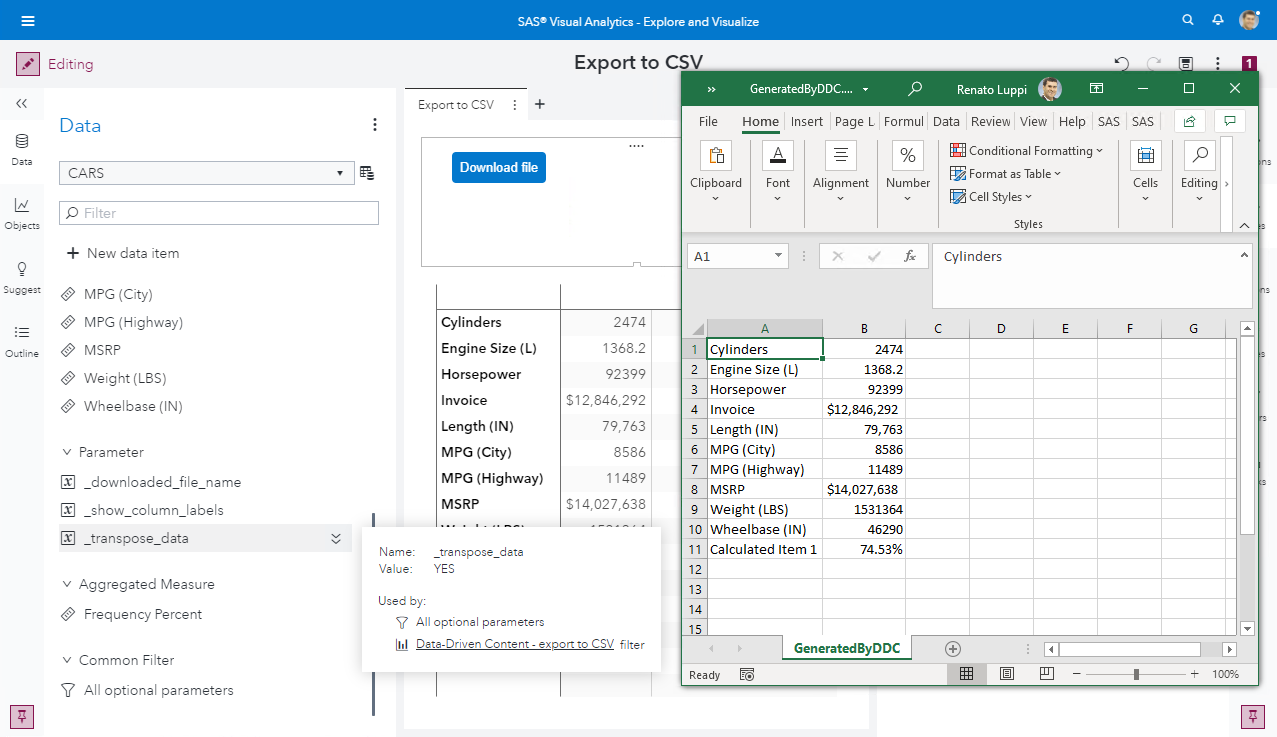
Export to CSV | Code
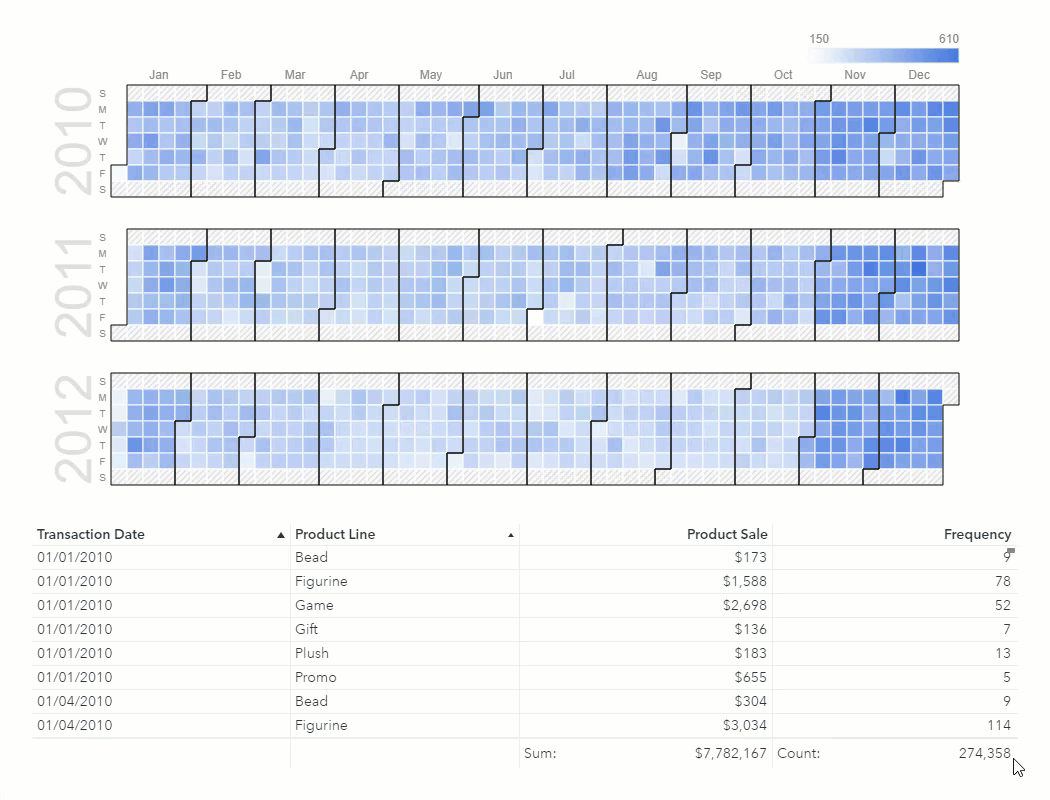
Google Calendar | Code
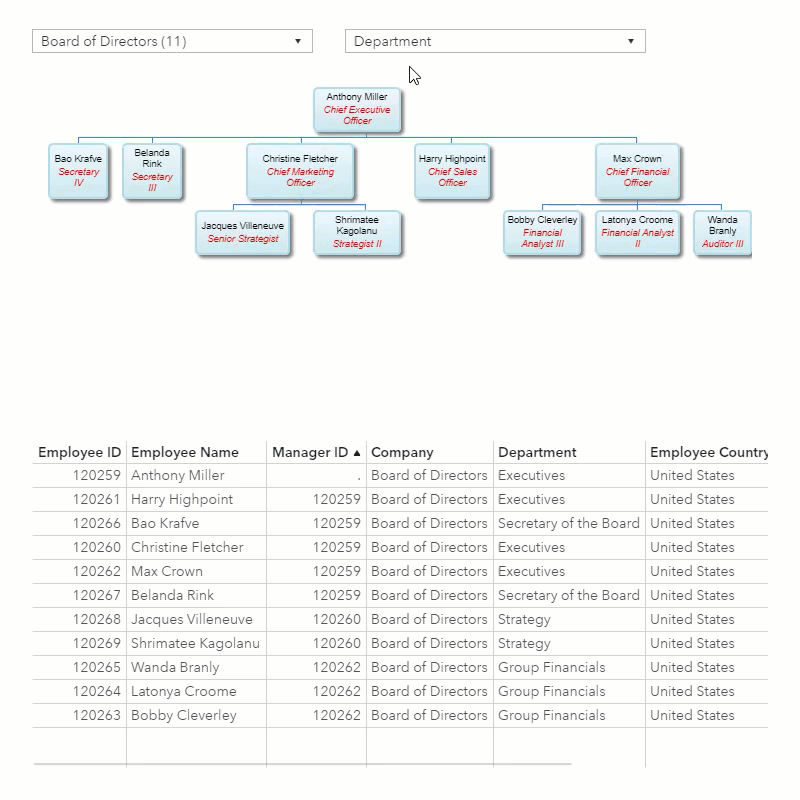
Google Organizational Chart | Code | Demo
Highcharts | Code | Demo
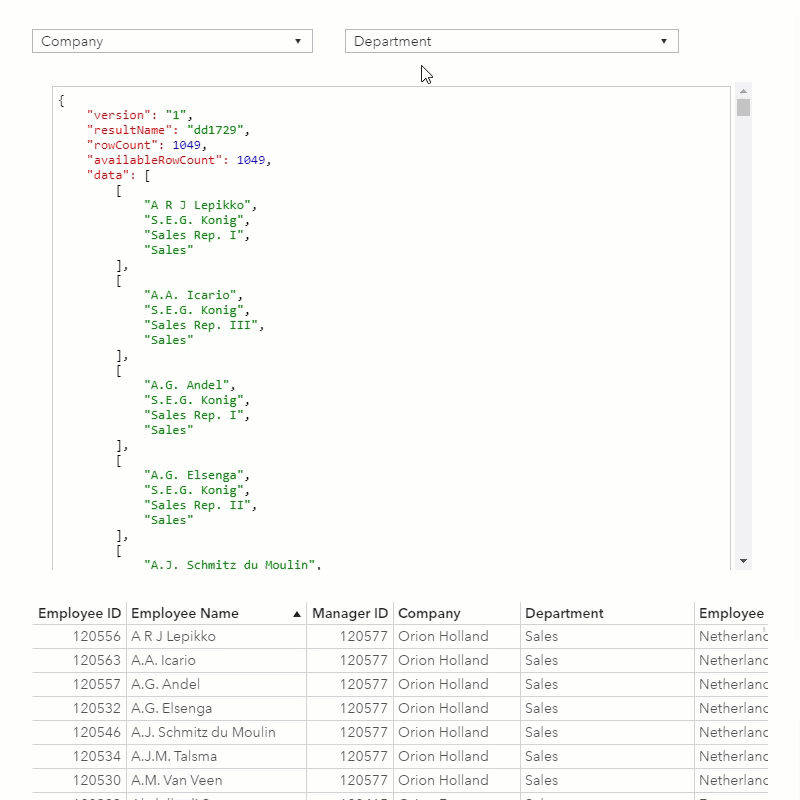
JSON Message Viewer | Code
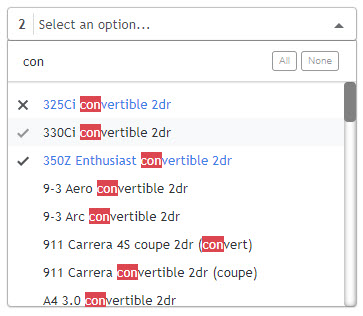
Multi Selector | Code
Tree Selector | Code
Image Viewer | Code
Interactive component to display images inside SAS Visual Analytics.
Bounding Box Viewer | Code
Interactive component to display dynamic bounding box annotations for computer vision applications.